Shareholder return to free cash flow
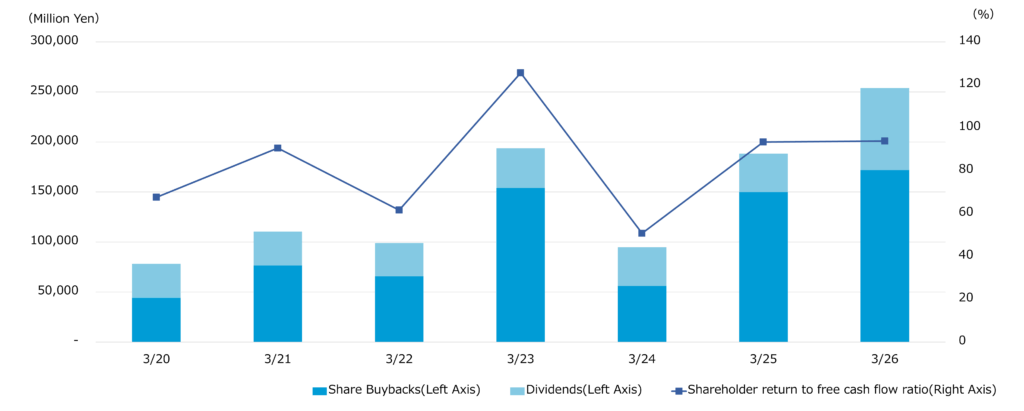
(Million Yen)
| 3/20 | 3/21 | 3/22 | 3/23 | 3/24 | 3/25 | 3/26 | |
| Shareholder return to free cash flow ratio (Right Axis)* | 67.5% | 90.5% | 61.6% | 125.6% | 50.7% | 93.3% | 93.7% |
| Share Buybacks | 44,283 | 76,675 | 65,764 | 153,973 | 56,052 | 150,012 | 171,970 |
| Dividends | 34,042 | 33,720 | 33,201 | 39,794 | 38,778 | 38,417 | 81,903 |
*(Dividends + Share Buybacks)/(Cash from operating activities + Cash used in investing activities)
Dividend per share(Yen)
| 3/20 | 3/21 | 3/22 | 3/23 | 3/24 | 3/25 | 3/26 | |
| Interim | 45.0 | 45.0 | 45.0 | 45.0 | 45.0 | 45.0 | 125.0 |
| Fiscal year-end | 45.0 | 45.0 | 65.0 | 65.0 | 65.0 | 115.0 | 170.0 |
| Full year | 90.0 | 90.0 | 110.0 | 110.0 | 110.0 | 160.0 | 295.0 |