Sales
+9.4%
723.6 billion yen
Sales Breakdown
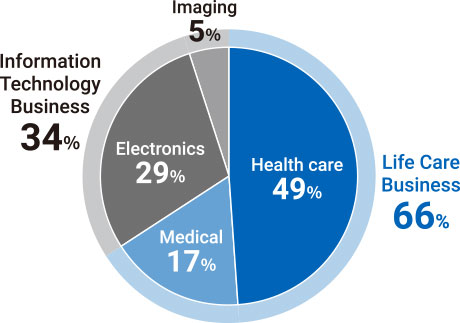
Sales revenue reached its highest level ever for HOYA. Although sales of glass substrates for HDDs declined sharply, business results in the Life Care business were firm and the Company benefited from a lower yen exchange rate. Growth rate was 9.4%. Growth rate net of exchange-rate effects was 1.2%.
Profit from Ordinary Operating Activities
+5.2%
210.8 billion yen
Profit margin from ordinary operating activities: 29.1% (-1.2%pt)
Profit from Ordinary Operating Activities Breakdown by Business
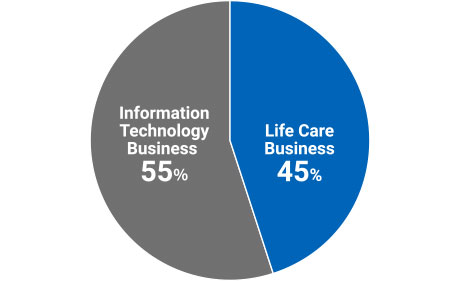
Profit from ordinary operating activities was the highest in HOYA’s history, thanks to increased revenue and thorough cost management. Profit margin declined as the Information Technology business, whose profit margin is relatively high, accounted for a lower percentage of sales revenue. Growth rate was 5.2%. Growth rate net of exchange-rate effects was 2.4%.
Product Sales/
Profit Margins/
Sales Growth Rate
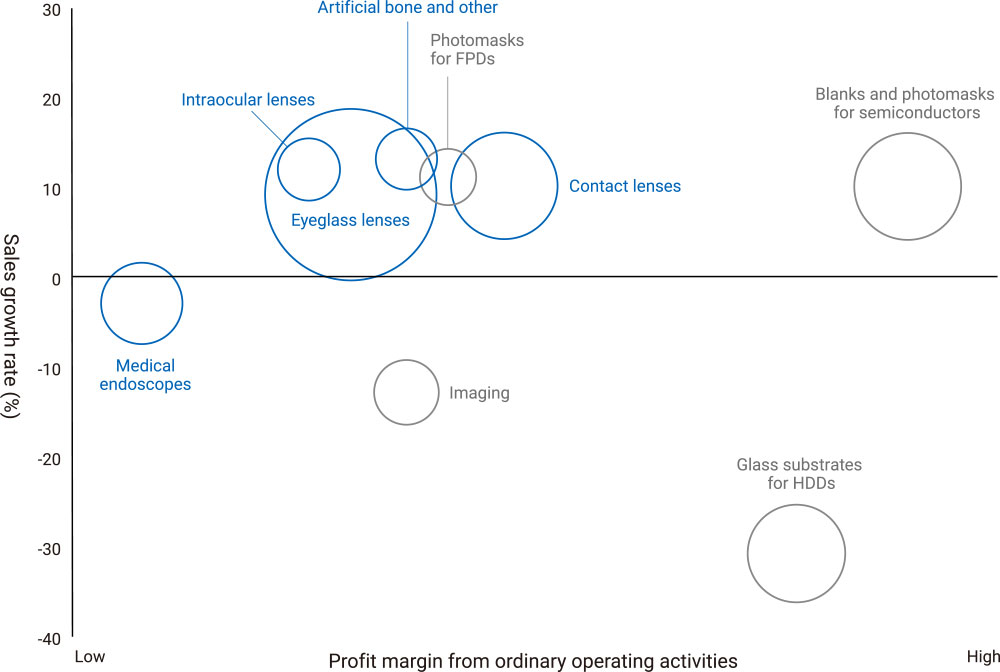
Note: Sales growth rate excluding FX impact
Sales in the Life Care Business
+16.5%
474.6 billion yen
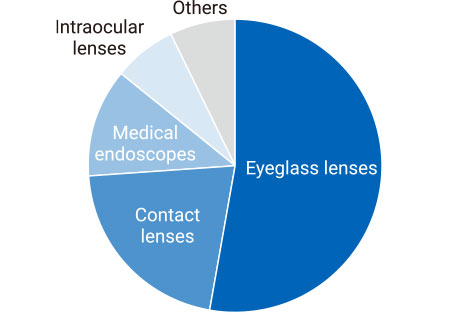
Sales revenue in the Life Care business soared as economic recovery advanced, thanks to firm sales of high-value-added products and recovery from the COVID-19 pandemic. Growth rate of sales revenue was 16.5%. Growth rate net of exchange-rate effects was 8.0%.
Life Care Sales Breakdown
Sales Growth Rate of Products in the Life Care Business*
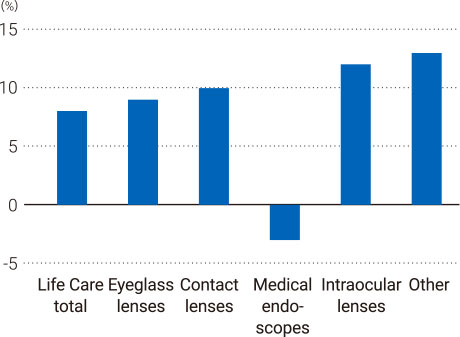
*Sales growth rate excluding FX impact.
Profit from Ordinary Operating Activities in the Life Care Business
+16.0%
96.8 billion yen
Profit margin from ordinary operating activities: 20.4% (-0.1%pt)
Profit from ordinary operating activities in the Life Care business increased, as virtually all businesses in this segment saw increased profits. Growth rate was 16.0%. Growth rate net of exchange-rate effects was 9.8%.
Sales in the Information Technology Business
-1.6%
244.3 billion yen
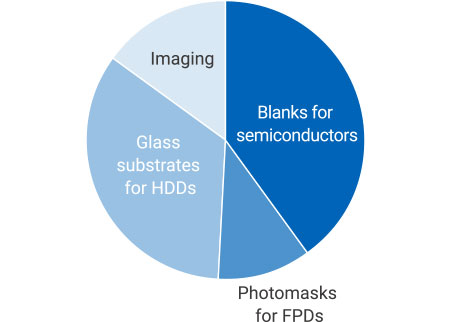
Sales in the Information Technology business declined from the previous fiscal year. Although the Company captured strong demand for mask blanks for extreme ultraviolet (EUV) lithography, sales of glass substrates for HDDs and camera lenses decreased slightly due to inventory adjustments in these products. Growth rate was -1.6%. Growth rate net of exchange-rate effects was -9.6%.
Information Technology Sales Breakdown
Sales Growth Rate of Products in the Information Technology Business*
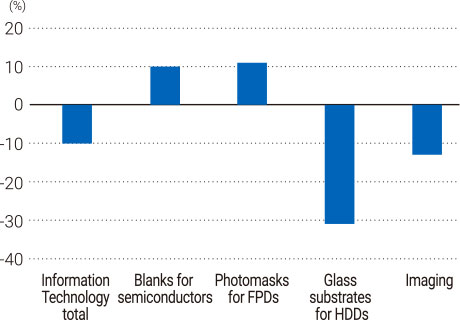
*Sales growth rate excluding FX impact.
Profit from Ordinary Operating Activities in the Information Technology Business
-1.9%
118.3 billion yen
Profit margin from ordinary operating activities: 48.4% (-0.1%pt)
In profit from ordinary operating activities in the Information Technology business, the Company supported a profit margin roughly equal to that of the previous fiscal year. Although revenue dropped sharply in the relatively high-margin business of glass substrates for HDDs, HOYA was able to implement thoroughgoing cost management in this business. The growth rate was -1.9%. Growth rate net of exchange-rate effects was -8.7%.
Financial data is available in the IR Library on HOYA’s website.