Remuneration for Directors and Executive Officers
Policy on Director Compensation
Compensation for Directors consists of fixed compensation and a long-term incentive plan in the form of Restricted Stock Units (RSUs).
Fixed compensation comprises base compensation as well as additional compensation for serving as a member or chairperson of Board committees. Compensation levels are determined appropriately based on factors including the Company's business environment, benchmarking data from external compensation surveys, and the individual's role and responsibilities.
RSUs were introduced in FY2022 in place of stock options. Under this system, shares are granted based on the period of service as an Independent Director, with the objective of aligning directors' interests with those of shareholders and promoting a long-term perspective on corporate value creation.
RSUs are granted annually. For each grant, a three-year performance period is established, and a target number of shares is specified for each Independent Director.
Fifty percent of this amount is delivered in the form of monetary compensation claims, which directors contribute in kind to receive shares equivalent to the applicable payment amount. The remaining fifty percent is paid in cash to facilitate tax payments. For non-resident directors who cannot receive shares through the stock compensation administration platform, as well as directors who retire due to unavoidable reasons such as death or illness and injury, the entire reference compensation amount is paid in cash. Additional RSU grants covering a new three-year period are made annually thereafter.
In FY2025, the Compensation Committee reviewed compensation structure and levels based on the Company's compensation philosophy, business environment, peer benchmarking, positions, and responsibilities, and determined compensation for each director to be appropriate and consistent with Company policy.
The Company considers the compensation paid to each director during the fiscal year to be in accordance with its compensation policy.
[Composition ratio of compensation for directors]
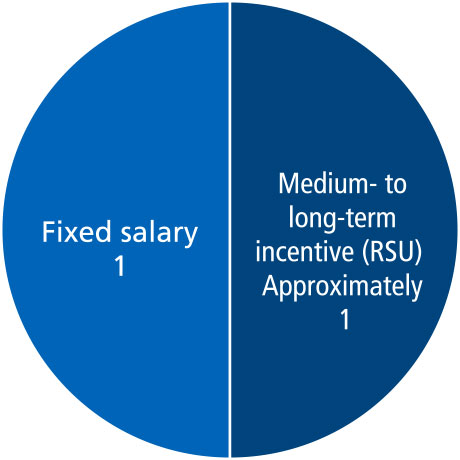
Assuming a share price in three years roughly equivalent to the share price when the RSU was granted.
Clawback and malus clauses: In the following cases, clawback and malus clauses shall be set forth, whereby the unpaid portion of the compensation under the RSU shall be reduced or disallowed, and a claim for return of all or part of such paid portion shall be made.
(1) The case in which the recipient resigns for personal reasons, for whatever reason
(2) The case in which the recipient is dismissed as a director of the Company
(3) The case in which the Board of Directors resolves to revise the financial statements as a result of material accounting error or fraud
(4) The case in which an unlawful act, such as significant negligence of duties or violation of laws and regulations, a breach of the internal rules of the HOYA Group, or a significant breach of contract, during the director’s term of office, is revealed
Executive Officer Remuneration Policy
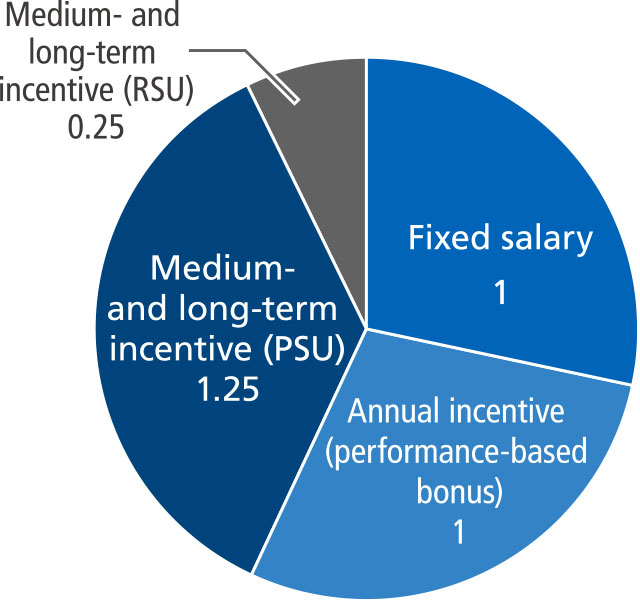
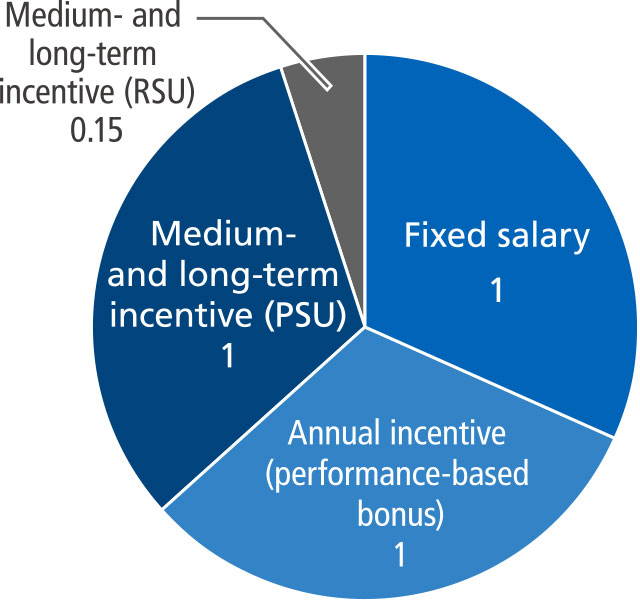
Executive Officer remuneration for FY2025 consists of fixed compensation, an annual incentive (performance-linked bonus), and medium- to long-term incentives comprising Performance Share Units ("PSUs") and Restricted Stock Units ("RSUs").
For FY2025, the Compensation Committee reviewed the remuneration structure and levels in light of the Company's basic policy, business environment, external benchmarking data provided by independent compensation consultants, and the role and responsibilities of each Executive Officer, and determined the compensation for each Executive Officer accordingly. The Company considers the remuneration of each individual Executive Officer for the fiscal year to be consistent with its remuneration policy.
Performance-linked Coefficient (Annual Incentive Bonus)
FY2025 Actual Results (Consolidated)
[FY2025 Composition ratio of compensation for executive officers]
CEO
Other executive officers
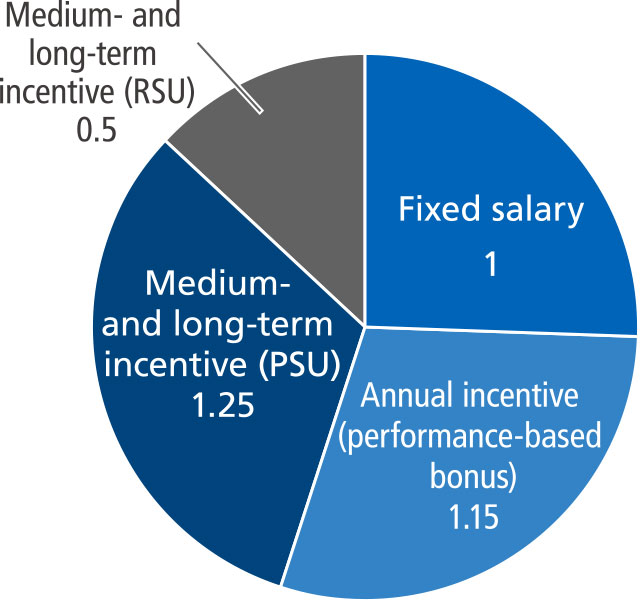
[Composition ratio of compensation for executive officers from FY2026 Onward]
CEO
Other executive officers
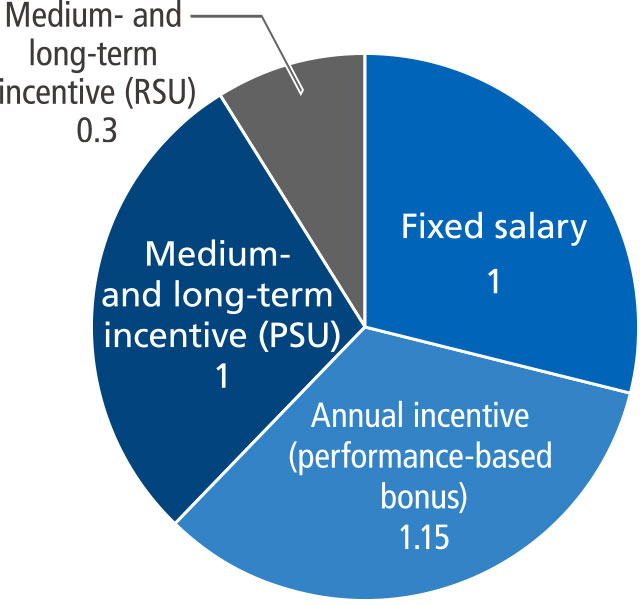
Assuming a share price in three years roughly equivalent to the share price when the PSU or RSU was granted.
Clawback and malus clauses: In the following cases, clawback and malus clauses shall be set forth, whereby the unpaid portion of the compensation under the PSU and RSU shall be reduced or disallowed, and a claim for return of all or part of such paid portion shall be made.
(1) The case in which the recipient resigns for personal reasons, for whatever reason
(2) The case in which the recipient is dismissed as an executive officer of the Company
(3) The case in which the Board of Directors resolves to revise the financial statements as a result of material accounting error or fraud
(4) The case in which an unlawful act, such as significant negligence of duties or violation of laws and regulations, a breach of the internal rules of the HOYA Group, or a significant breach of contract, during the Executive Officer’s term of office, is revealed
■Fixed Compensation
Base compensation is determined according to each Executive Officer's position and responsibilities (such as Representative Executive Officer and Chief Financial Officer) and includes allowances associated with overseas assignments, such as home leave expenses.
Compensation levels are set at an appropriate level, taking into account the Company's business environment, external benchmarking data provided by independent compensation consultants, and the role and responsibilities of each Executive Officer.
The Company abolished retirement benefits for directors and officers in 2003. However, severance pay may exceptionally be provided upon retirement at the discretion of the Compensation Committee. The amount and terms are determined on a case-by-case basis, considering factors such as position and circumstances of retirement.
■Performance-Linked Bonus
The performance-linked bonus is determined based on both quantitative and qualitative assessments and may range from approximately 0% to 200% of the target amount.
Quantitative performance metrics include consolidated revenue, profit attributable to owners of the Company, and earnings per share (EPS).
Performance-linked Coefficient (Annual Incentive Bonus)
Indicator |
Target (Consolidated) |
FY2025 |
Reason for the |
|---|---|---|---|
Revenue |
905.1 billion yen |
947.7 billion yen |
Selected as an indicator for its measurement of the Group’s degree of growth in domestic and overseas markets |
Profit |
203.1 billion yen |
253.1 billion yen |
Selected as an indicator for its measurement of whether the Group’s growth is accompanied by solid profits |
Basic earnings |
592.43 yen |
743.93 yen |
Selected as an indicator for its measurement of the Company’s degree of growth from a shareholder’s perspective |
The qualitative assessment method relevant to an annual incentive (performance-based bonuses) involves assessments of items such as the degree of achievement of budget targets in the division under management. Final decisions are made following deliberation by the Compensation Committee.
The target values in the table above are set taking into consideration such factors as the Company’s business environment, and as such may differ from performance forecasts.
■Performance Share Units (PSUs)
The PSU plan was introduced in FY2019 as a replacement for stock options.
Each year, Executive Officers are granted a target number of shares based on their position and responsibilities, together with mid- to long-term performance targets covering a three-year performance period. Following the end of the performance period, shares are delivered based on the level of achievement against predetermined performance conditions.
The payout ratio ranges from 0% to 200% based on performance over the three fiscal years. Performance measures include consolidated revenue, earnings per share (EPS), and return on equity (ROE), as well as ESG metrics selected annually, such as external ESG ratings and progress on priority ESG initiatives.
2023 |
2024 |
2025 |
2026 |
2027 |
2028 |
2029 |
|---|---|---|---|---|---|---|
PSU |
Share Delivery, etc. |
|||||
PSU |
Share Delivery, etc. |
|||||
PSU |
Share Delivery, etc. |
|||||
PSU |
Share Delivery, etc. |
Fiscal 2023 allocation (Target period: fiscal year ended March 2024 to fiscal year ended March 2026)
Financial metrics represent the average value over the three-year performance period.
Indicator |
Weight |
Target |
Actual |
|
|---|---|---|---|---|
Revenue |
25% |
800 billion yen |
858.8 billion yen |
|
Earnings per share (EPS) |
25% |
560 yen |
614 yen |
|
ROE |
25% |
20.00% |
22.2% |
|
ESG |
Sustainalytics |
15% |
Negligible |
Low |
CDP |
B |
B |
||
DJSI |
73–79 points |
42 points |
||
Female Management |
10% |
18% |
17.4% |
|
Engagement Score |
77 points |
74 points* |
||
The latest available assessment results, namely FY2024 scores, were used.
Basic deliverable number of shares
Position/responsibilities |
FY2024 allocation |
FY2025 allocation |
FY2026 allocation |
|---|---|---|---|
CEO |
7,300 shares |
8,900 shares |
6,200 shares |
CFO |
3,400 shares |
4,100 shares |
2,800 shares |
CSO |
2,500 shares |
3,100 shares |
2,100 shares |
Targets for FY2024-FY2026 Grants
Financial metrics represent the average value over the three-year performance period.
Indicator |
Weight |
FY2024 |
FY2025 |
FY2026 |
Reason for |
|
|---|---|---|---|---|---|---|
Financial Indicators *1 |
Revenue |
25% |
830.0 |
980.0 |
1,070.0 |
Selected as an indicator to measure growth potential of the HOYA Group in the domestic and overseas markets |
EPS |
25% |
570 yen |
670 yen |
840 yen |
Selected as an indicator to measure growth of the Company from the same perspective as shareholders |
|
ROE |
25% |
20.0% |
20.0% |
24.0% |
Selected as an indicator to measure whether the Company has generated return on shareholders’ investment effectively |
|
ESG |
25% |
Enhancement of IT Governance (50%) |
Evaluation by external organizations (50%) |
Eye Health Prevention Initiatives (40%) |
Indicators to measure the initiatives |
|
*1 The targets shown in the table above are not earnings forecasts. They have been established with reference to the Company's business environment and market consensus.
*2 Assessments by CDP and DJSI are used.
*3 Figures in parentheses indicate the weighting of each item within the ESG targets.
The ESG metrics incorporated into executive compensation are linked to the Company's sustainability-related materiality topics and include the following:
・Climate Change: Renewable energy utilization ratio (with progressive targets toward achieving 60% by FY2030)
・Diversity: Percentage of women in management positions in Japan (target of 20% by FY2028)
・Occupational Health and Safety (Health and Productivity Management): Implementation rate of internal eye health prevention initiatives (target of 100% by FY2028)
■Restricted Stock Units (RSUs)
The RSU plan was introduced in FY2025 in addition to the PSU plan to further align Executive Officers' interests with sustainable growth in corporate value and to attract and retain highly qualified talent. The plan is intended to establish a remuneration framework that remains competitive with those of global companies.
Under the plan, shares are delivered upon retirement based on the Executive Officer's period of service. Each year, a target number of shares is determined for a one-year service period, with different calculation methodologies applied to the CEO and other Executive Officers.
FY2025
・CEO: Base compensation × 0.25 ÷ Reference Share Price
・Other Executive Officers: Base compensation × 0.15 ÷ Reference Share Price
FY2026
・CEO: Base compensation × 0.50 ÷ Reference Share Price
・Other Executive Officers: Base compensation × 0.30 ÷ Reference Share Price
Upon completion of each service period, the confirmed target number of shares is accumulated throughout the Executive Officer's tenure. Upon retirement, the notional value of the award is determined by applying the Company's share price at the time of retirement to the accumulated target number of shares.
Fifty percent of the award value is granted as a monetary compensation claim. Executive Officers receive Company shares by making an in-kind contribution of such claim, while the remaining 50% is paid in cash to facilitate tax withholding obligations.
For non-resident Executive Officers who are unable to receive shares through the stock compensation administration platform, as well as in cases of retirement due to unavoidable reasons such as death or illness and injury, the full award value is paid in cash.
Total amount of remuneration, etc. of Directors and Executive Officers for the fiscal year under review
Classification |
Number of |
Total |
Total amount of remuneration by type |
|||||
|---|---|---|---|---|---|---|---|---|
Fixed salary |
Performance- |
Stock |
PSU |
RSU |
||||
Directors |
Independent |
5 |
198 |
78 |
- |
4 |
- |
116 |
Internal |
2 |
10 |
10 |
- |
- |
- |
- |
|
Total |
7 |
208 |
88 |
- |
4 |
- |
116 |
|
Executive |
3 |
1,063 |
246 |
343 |
- |
474 |
20 |
|
Total |
10 |
1,291 |
334 |
343 |
4 |
474 |
136 |
|
At the end of the fiscal year under review, there were seven directors (five independent directors and two internal directors) and three executive officers (two are concurrently directors).
For stock options, the fair value of stock acquisition rights was calculated and amounts to be recorded as expenses for FY2025 are shown in the table above. For executive officers, no stock options were newly granted in FY2025 due to the introduction of PSU in place of stock options from FY2019. Also, for independent directors, from FY2022 RSU is introduced in place of stock options. Although no stock options were granted in FY2024, the table above shows stock options granted in past fiscal years in amounts to be recorded as expenses for FY2025.
For PSU and RSU, the table above shows amounts to be recorded as expenses for FY2025.
Amount of consolidated remuneration for each Director
Chief Executive Officer (CEO)
Name |
Executive |
Total |
Fixed |
Performance- |
Stock |
PSU |
RSU |
|---|---|---|---|---|---|---|---|
Eiichiro Ikeda |
Director |
5 |
5 |
- |
- |
- |
- |
Representative |
562 |
124 |
172 |
- |
254 |
12 |
Executive Officers (whose consolidated remuneration, etc. totaled 100 million yen or more during the consolidated fiscal year)
Name |
Executive |
Total |
Fixed |
Performance- |
Stock |
PSU |
RSU |
|---|---|---|---|---|---|---|---|
Ryo Hirooka |
Director |
5 |
5 |
- |
- |
- |
- |
Representative |
299 |
71 |
97 |
- |
126 |
5 |
|
Tomoko Nakagawa |
Executive |
222 |
51 |
74 |
- |
94 |
3 |